The Morningstar 2016 Global Asset Flows Report analyzes the flows that investors placed in global open-end funds and exchange-traded products during the past year and what these trends reveal about past performance, as well as investor behavior and expectations going forward. The report contains a global overview and a region-specific section delving a little deeper into the U.S., the largest investable market in the world. Some highlights:
Worldwide flows decreased to $728 billion in 2016 from $1 trillion in 2015, signaling diminishing investor confidence in global markets. Although some areas with potential for growth still remain (especially in emerging markets such as India and China), most developed countries seem stuck in sluggish 2%–3% GDP growth territory. When future potential returns are this weak, people are more hesitant to invest.
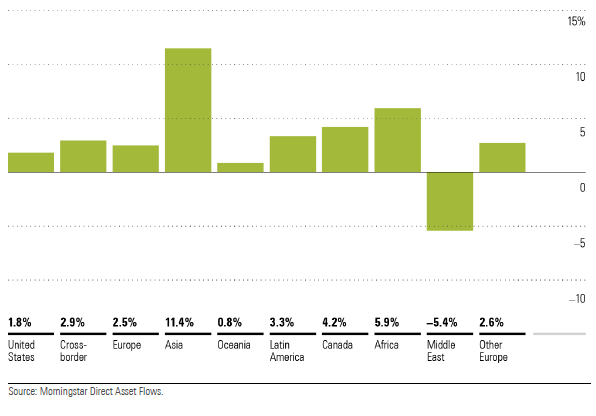
In terms of organic growth rate (flows over beginning assets), Asia showed the strongest growth, at 11.4% (Exhibit 1). Some of this growth has been fueled by the Japanese central bank buying local exchange-traded products. The only other regions displaying a robust growth rate were Africa and, to a lesser extent, Canada and Latin America. The developed economies (U.S., cross-border, and Europe) saw their investments grow only by the same lethargic rates as their GDPs. The Middle East turned negative because of weak oil prices.
Exhibit 1:2016 Organic Growth Rate by Region
With cross-classification of flows by region and global category group, in U.S., fixed income and money market grabbed the lion's share of the flows, while allocation sustained considerable damage with $42.6 billion in outflows. In contrast, allocation funds remained somewhat popular in Europe and cross-border, although their inflows this year were not anywhere as high as what poured into fixed income. Alternative funds also remained in favor with European and cross-border investors, but not so much so with American ones. Commodities were popular in all major regions except Asia.
The United States attracted $288 billion in new flows in 2016, an increase from $260 billion in 2015. Europe, Asia, and Cross-Border, however, saw their inflows diminish compared with the previous year. The fastest-growing region was Asia, followed by Africa, Canada, and Latin America.
The pattern of flows by category group was very different from 2015. The category groups that received the largest flows in 2016 were fixed income and money market ($412 billion and $196 billion, respectively). In 2015, the top receiving category group was equity, with $346 billion, followed by allocation, with $167 billion. In terms of organic growth rates, commodities grew the fastest at 25.7%.
After favoring both U.S. and world ex-U.S. equity funds for three consecutive years, investors turned to fixed income in 2016. In a year that brought about Brexit and a surprising result to the U.S. presidential election, bonds were the investment of choice. Investors might have been: 1) looking for less risky assets; 2) trying to position portfolios in anticipation of rising interest rates; 3) selling off equities at the top of a bull market; or all three.
It seems that there is no stopping the massive migration of assets from active to passive, especially in the equity space. Indexing has also expanded from equity into other categories, and from the U.S. to other regions. However, indexing in equity is still predominant for all major regions.
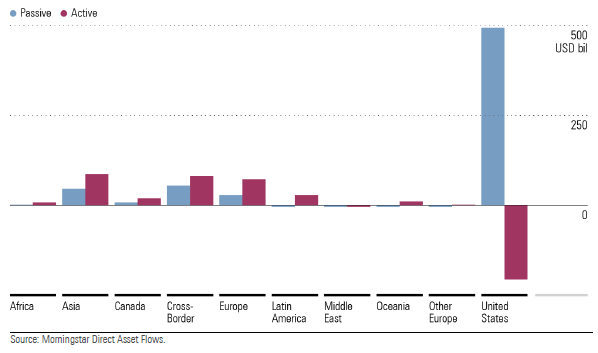
The percentage for Asia is overstated because Japan's government has been purchasing ETPs as part of its stimulus plan, with the effect of artificially increasing the percentage of passive assets. In the U.S., the gap between active and passive flows has never been wider (Exhibit 2). U.S. index funds received $492 billion in 2016. Their active counterparts, in sharp contrast, saw $204 billion fly out the door.
Exhibit 2: Flows for Active and Passive Funds by Region
(USD Billion)
ETP assets continued to grow, reaching $3.6 trillion globally at the end of 2016. These types of products are becoming more and more popular in a climate where the high growth rates of years past are becoming legend and investors are increasingly sensitive to fees, to the point where they are dropping more-expensive funds and buying lower-cost options.
Vanguard continued to dominate the asset-management industry, followed by BlackRock (and its iShares unit) and Fidelity. The fastest-growing firm in the top 10 was State Street. Generally, firms that expanded their product lines to include exchange-traded products and lower-cost options have benefited, while the ones more focused on traditional active management have suffered (most notably, Franklin Templeton).
*Cross-border funds are funds domiciled in tax havens such as Luxembourg and Ireland and distributed in many markets, primarily in Europe, but also in Asia, Latin America, and the Middle East.
You are welcomed to download the full 2016 Global Asset Flows Report here.