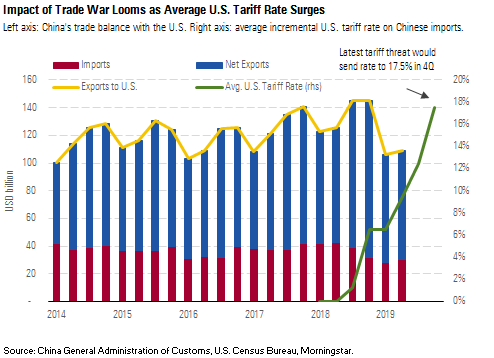
China’s economy remains in the doldrums. Growth bumped up slightly in the second quarter according to our broad proxy (despite officially reported growth being down); this was probably spurred by the rebound in credit growth in the first quarter. However, credit growth stalled out in the second quarter, and we believe it will continue to do so, signaling flat economic growth for the rest of this year. Meanwhile, the trade war impact looms, with the average U.S. tariff rate on China set to surge to 17.5% pending the September implementation of the recently ordered tariffs on all of the remaining untargeted imports, sending China’s currency into steep depreciation so far in August.

Growth May Have Recovered Slightly in 2Q
China’s official real GDP growth fell to 6.2% in the second quarter from 6.4%. However, our alternative broad proxy actually increased to a 5.8% growth rate after hovering around 5.4%-5.6% in the prior three quarters. The timing of a second-quarter growth rebound is logical--credit growth began increasing in January from trough levels, and economic growth typically follows credit with a one- to two-quarter lag. We think the official GDP figures have missed both the timing and the magnitude of China’s slowdown. We think that growth began slowing at the end of 2017 following a credit slowdown. Quite plausibly, China deferred recognition of its economic slowdown until the end of 2018 in order to use the U.S.-China trade war as a scapegoat for slower growth.
The rebound in our broad proxy index was mostly attributable to a sharp rebound in consumer durables demand, probably partly due to the subsidence of trade war worries until the renewal of conflict in mid-May. According to the official figures, the services sector has been the larger driver of the growth slowdown. Meanwhile, nominal growth in the industrial sector is down almost 700 basis points since the beginning of 2017, but real growth has been reported as flat owing to a collapsing deflator. This fall in the deflator is somewhat plausible given the fall in producer price inflation, but in the past (such as 2014-16), it appears the official figures have hidden a real growth slowdown by using an underestimated deflator. China’s march to deleveraging has ended for now, but the gap between credit growth and nominal GDP growth has stabilized.
Following a precipitous drop in the first quarter, China’s exports to the United States stabilized in the second quarter. Net exports to the U.S. were actually up slightly year over year, as an 8% drop in exports was more than offset by a 28% drop in imports. Nevertheless, the pattern of recent months suggests a deferred impact from incremental tariffs, which weren’t hiked until May. The average incremental U.S. tariff rate on China has now reached 12.5% and will increase to 17.5% in the fourth quarter pending implementation of the recently ordered 10% tariffs on all of the remaining untargeted U.S. imports from China. Overall, China’s goods trade balance has remained stable in recent quarters. However, declining net imports from Asian trading partners probably reflects temporary improvement as China curtails imports of intermediate inputs in preparation for a decline in U.S. exports. So far, China has not had to sell off meaningful amounts of its foreign currency reserves. This is in part because capital outflows have been modest, but also because China has been more flexible in allowing its currency to depreciate: In early August, the yuan/dollar exchange rate crossed 7 for the first time since 2008.
Fixed-Asset Investment Will Continue to Support China’s Economic Growth
China’s nominal fixed-asset investment slowed to 5.5% in the second quarter from the first quarter’s 6.3%. Our raw-materials-based monthly gauge of real fixed-asset investment also slowed slightly, with growth of 8.1% in the second quarter versus 8.3% in the previous quarter. In our view, fixed-asset investment growth will remain stable in the near term. While the acceleration of local government bond issuance and easing restrictions on these bonds to fund infrastructure projects have supported a limited investment recovery since mid-2018, we do not expect a large-scale stimulus as China’s leverage remains high.
Manufacturing fixed-asset investment growth further decelerated to 2.2% in the second quarter from 4.6% in the first quarter as a result of domestic and external headwinds. The real estate sector continued to underpin fixed-asset investment growth, with investment growing 10.8% in the second quarter, albeit slower than the first quarter’s 11.4%. Growth from this sector may slow soon, with developers facing restrictions in accessing the bond market. Alternative measures of real estate investment (starts and floor space under construction) also show decelerating growth, with starts by developers (commodity building) slowing to 9% in the second quarter from 12% in the first. It is not surprising that state sector spending grew faster at 7.0% in the second quarter versus 4.7% for the private sector due to the government’s stimulus policy, while the private sector is affected by trade concerns and lack of access to capital markets.
While there are concerns about a slowdown in the property sector, some developers are still on track to achieve their annual sales targets, with China Overseas Land Investment ahead of its own target in the first half of 2019. On the other hand, thanks to government stimulus and a new-equipment replacement cycle, machinery sales remain robust, and both Sany Heavy Industry and Zoomlion Heavy Industry recently reported preliminary first-half net profit that beat our expectations. We note similar strength in the cement industry, with companies like China National Building Material and Asia Cement expecting profit growth of more than 50% on the back of higher cement prices. We believe that cement prices were supported by the expectation of firm infrastructure spending and supply-side reform by the government. However, our long-term view on cement demand is bearish, as we expect both fixed-asset and real estate investments to slow eventually because of China’s transition to a consumer-driven economy. Similarly, steel selling prices for Baoshan Iron & Steel, a subsidiary of China’s largest steelmaker, are also holding up well. That said, we believe the steel industry is highly commoditized and will continue to suffer from overcapacity issues in the long run.
Consumption Growth Still Weak in 2Q, Though Durable Goods Demand Ticked Up
Official retail sales growth jumped to 9.8% in June from 8.7% in March. However, the uptick was mainly driven by a higher inflation rate, to 3.1% from 1.8%, due to soaring food prices (pork, vegetables, and fruits), while real retail sales growth contracted slightly to 6.7% from 6.9%. Climate-change-induced extreme weather and African swine fever were the main reasons behind the hike in food prices. We expect more pork price inflation, but its impact will be limited, as we estimate that the pork share of the consumer price index basket is only about 2%. National Bureau of Statistics household survey data also painted a picture of weaker consumption growth, with expenditure growth, excluding residence, falling to 6.8% from 7.1% in the first quarter.
The food, clothing, and household goods component of the household survey consumption data indicated an improvement in goods demand, growing at 6.4% versus 3.6% in the first quarter. However, the growth of services categories slowed: Education, entertainment, and other fell to 4% from 18% in the first quarter. Healthcare remained steady at about 10%, but well below the 17% averaged in 2018. Our alternative measures of services demand also indicated a slowdown, although these capture a limited representation of the services sector.
Our alternative measures of real consumer goods demand indicated a slight improvement in the second quarter, with growth in our durables index improving to 3.8% from 1.3% in the first quarter. Our staples index (trailing 12 months) slid again to a very weak 1% from 2%, as we saw a broad slowdown in different categories. We still question whether the uptick in apparent demand for items like washing machines (due to falling net exports) represents an actual increase in demand or merely an inventory buildup. Also, on a trailing 12-month basis, our durable index weakened to 1.5% from 2.3% (also weakening even after stripping out the sluggish auto sales data). Meanwhile, demand for staples has been pulled down by collapsing meat demand, due to high prices caused by swine fever.
Despite weak volume growth--staples are around low single digits for most of the companies we cover--the story was unchanged for the first half and probably will be for the rest of 2019: Corporates’ sales growth will outpace volume growth, buoyed by higher average selling prices from mix shifting toward premium products. In the meantime, we expect improving profitability for most of the companies, as the 3% value-added tax rate cut that applies to the manufacturing sector came into force in April.
Total Social Financing Growth Flat in 2Q After Rebound in 1Q
Over the second quarter, the People’s Bank of China continued to inject liquidity and roll out policies to encourage financing to small and midsize enterprises, with a visible impact on interbank rates. However, the impact of credit has been underwhelming: Our adjusted total social financing measure remained flat with the previous quarter at 11.4% year-over-year growth, despite the prior quarter’s bounceback from trough growth of 10.3% in December. Flat credit growth fell in line with our prediction that credit growth would remain at 11%-12% in 2019--providing a sufficient boost to stabilize the economy but not create a full recovery (as occurred in the 2013 and 2016 easing cycles).
Government bond growth remained high at about 20%, and the decline in shadow banking lending decelerated from negative 10% to negative 8%. However, this was fully offset by a contraction in loan growth to 8% from 8.3% in the prior quarter. Household loan growth slowed slightly, particularly for short-term loans, as banks have become wary of rising credit card loan risk after rapid expansion over the past six years. However, the primary driver of slower loan growth has been a pullback in nonfinancial enterprise borrowing to a 11.2% growth rate from 11.9% in March. While corporates have redirected some of their borrowing to the bond market, this hasn’t fully offset falling loan growth. Rates have fallen over the past 18 months, but credit spreads remain high, helping explain why we haven’t seen a surge in bond borrowing as occurred in the 2016 easing cycle.
Corporate debt/GDP looks to increase to around 171% in 2019, and we also forecast increases in household debt to 55%. As a result, we estimate overall credit/GDP will approach 266% at the end of 2019, so China is not yet deleveraging.
The interbank rate fell to a postcrisis low as the PBOC injected liquidity to support lending to smaller banks after the state takeover of Baoshang Bank in May. The takeover reduces any liquidity shocks to the market, while the one-year creditor backstop signals that regulators will limit their support. The fall in short-term interbank rates has failed to pass through to end borrowers. Both declines in bank wealth management product yields and average bank loan rates have lagged the interbank market rate decline by about six months and at much smaller magnitudes. This presses the need for replacing the loan benchmark rate by introducing the loan prime rate, as a part of regulators’ efforts to fix the long-blamed two-track system of lending rates in China.
The information contained within is for educational and informational purposes ONLY. It is not intended nor should it be considered an invitation or inducement to buy or sell a security or securities noted within nor should it be viewed as a communication intended to persuade or incite you to buy or sell security or securities noted within. Any commentary provided is the opinion of the author and should not be considered a personalized recommendation. The information contained within should not be a person's sole basis for making an investment decision. Please contact your financial professional before making an investment decision.


