In part 1 of this article, we saw the unprecedented dislocations in ETF discounts. In part 2, we are revisiting the basics of ETF premiums and discounts.
What Is NAV?
Net asset value is the total value of an ETF's assets less the total value of its liabilities. The composition of an ETF's assets will vary but will generally comprise stocks, bonds, and/or cash. If the fund uses physical replication to track its benchmark (that is, it owns securities, not derivatives), the assets are the component securities (or a sampling thereof) of its benchmark index, any accrued income generated through securities lending, and some cash. Liabilities for ETFs and other funds will largely consist of fees owed to the fund company. An ETF's NAV per share can then be calculated by dividing the total NAV of the fund by its number of outstanding shares.
NAV = (Total Value of Assets - Total Value of Liabilities) / Number of Shares
What Is iNAV?
Traditional open-end mutual funds calculate their NAV once per business day, after most exchanges have closed and third-party pricing services have disseminated up-to-date price information for various securities. Funds use that value as the price for new purchase or redemption orders placed throughout the day. New investors will purchase fund shares at end-of-day NAV (less any fees), and investors exiting funds will also do so at end-of-day NAV (again, less any fees). This single price for purchases and sales, set using end-of-day prices for all the assets in the portfolio, helps make purchases of traditional funds simple and typically fair.
ETFs offer intraday liquidity. They are priced throughout the trading day and purchased or sold at the prevailing market price. Thus, a regular intraday measure of these funds' NAV can be (somewhat) useful in gauging what (some) portfolios are worth during the trading day. This in turn can help investors see whether they are paying or receiving a fair price.
This intraday portfolio value is called the fund's indicative net asset value, or iNAV. The iNAV is calculated at regular intervals (usually every 15 seconds) throughout the course of the trading day. However, unlike traditional open-end mutual funds, ETF investors trading during market hours will not transact at the most recent iNAV (which is mostly symbolic, a touchstone of sorts). Instead, ETF investors will likely execute their trades at a premium or discount to a fund's true value.
Premiums and Discounts
ETFs' market prices will generally not track their NAV nor market makers' own estimate of their value in lock step. If a fund's market price is higher than its NAV, it is said to be trading at a premium, which is good for sellers and bad for buyers. Paying $50.49 for a fund whose component securities are worth $49.99 in aggregate will inherently harm your expected returns. When the market price is lower than the current value of the portfolio, the ETF is trading at a discount, which helps buyers and harms sellers. Paying $49.99 for a share in a fund whose component securities are worth $50.49 could only improve your expected returns.
Luckily, ETFs typically trade at prices that are very close to their NAV. Even the examples above, of a 1% premium or discount, would be an exaggeration for nearly all ETFs. This is because any premium or discount that arises presents an arbitrage opportunity for authorized participants, or APs--a special "breed" of market makers with the ability to create and redeem new ETF shares directly with a fund's sponsor. APs are able to create and redeem ETF shares by exchanging a predetermined basket of securities and/or cash for new ETF shares and vice versa. If an ETF's market price strays too far from its NAV, market makers will move to profit from the relative mispricing between the fund's market price and the aggregate price of its underlying securities.
For example, if the component securities of a given fund are worth $49.99 per ETF share and the ETF's shares are changing hands for $50.49 each, a market maker can deliver that basket of securities to the ETF provider in exchange for new ETF shares and subsequently sell the new ETF shares on the open market. The market maker will pocket a small profit for the effort (which will likely be less than $0.50 per ETF share given the costs involved in this process). As market makers compete for these opportunities to make a quick low-risk profit, they serve to minimize the size and persistence of premiums and discounts for the fund's shares.
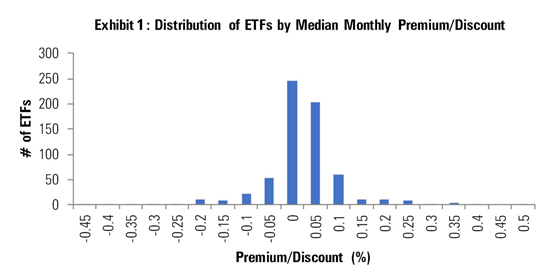
Exhibit 1 is a testament to APs' hard work. It is a histogram showing the distribution of the median of monthly premiums and discounts for the 645 ETFs for which Morningstar has this data available going back 10 years. You'll notice that sizable and persistent premiums and discounts are the exception rather than the rule. In fact, 500 (78%) of the ETFs in this group have tended to trade at a premium/discount to their NAV that ranged from negative 0.05% and 0.05% during the period in question. But there are exceptions to account for.

In part 3 of this article, we will look at some examples of premiums and discounts at different scenarios and discuss how investors can monitor and manage premiums and discounts?


