In July, published our sixth-annual Global Guide to Strategic-Beta Exchange-Traded Products1. In the latest installment of this guide, we found that strategic-beta ETPs in the Asia-Pacific region have continued to show stronger growth in 2019 relative to more mature markets, such as the United States and Europe. In the wake of the coronavirus-driven sell-off and subsequent rebound, we will look at a fresh snapshot of the strategic-beta ETP landscape in the Asia-Pacific region. We will also examine how these products have weathered the pandemic and see what lessons investors can learn from their first-half 2020 performance.
Growth Continues but Has Been Spotty
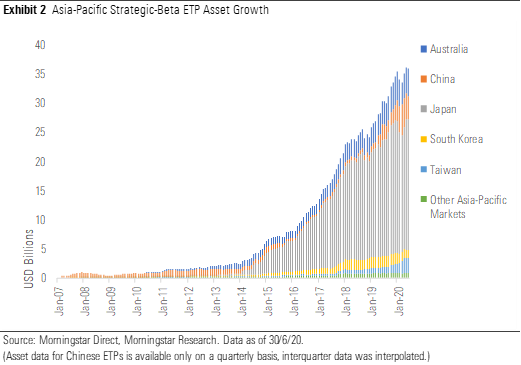
Strategic-beta ETP assets in the Asia-Pacific region grew at an organic growth rate of 24.6% in 2019. In the in the first six months of 2020, they grew by 11.9% organically. However, growth has been spotty. Much of this recent growth was driven by China, where there have been 10 new strategic-beta ETPs listed in 2020. (Some of them launched in 2019 but had yet to report assets to our database, so they were not included in our sixth-annual guide.) These new entrants helped China-domiciled strategic-beta ETPs achieve an organic growth rate of 51.4% in the first half of 2020. Taiwan also experienced strong organic growth (64.8% in the first half of 2020), which was mostly attributable to flows into one product, Yuanta/P-Shares Taiwan Dividend Plus ETF (0056). On the other hand, the number of strategic-beta ETPs in South Korea declined to 82 from 87. Assets in South Korean strategic-beta ETPs shrank to USD 1.4 billion, as organic growth registered at negative 10.6%. Japanese strategic-beta ETPs also contributed to the overall growth of the regional market. Growth in Japan was bolstered by the Bank of Japan's ETP purchases.

Quality and Dividend Strategies Remain in Favour
Inspecting cash flows across the various strategic-beta groups reveals clear preferences, similar to those we documented in 2019. In the first half of 2020, inflows were concentrated in the quality and dividend strategic-beta groups. In absolute terms, the Bank of Japan's exchange-traded fund purchases continued to fuel the growth of ETPs in the quality strategic-beta group. A number of newly listed ETPs in China further fueled in this group. Some Asian investors continued to favour dividend strategies in light of the low-interest-rate environment. Taiwan's dividend ETPs contributed around half of the net inflows into ETPs in the dividend strategic-beta group, while China's dividend ETPs contributed around one third of the group's net inflows.
Lessons Learned
The Asia-Pacific strategic-beta ETP market is very fragmented and has a shorter history than those in the U.S. and Europe. In addition, like in the U.S. and Europe, each market in the Asia-Pacific region is fundamentally different. Thus, analyzing the Asia-Pacific market as a whole is difficult. That said, when reviewing the first-half 2020 performance of strategic-beta ETPs in the region, we can still isolate some key trends.
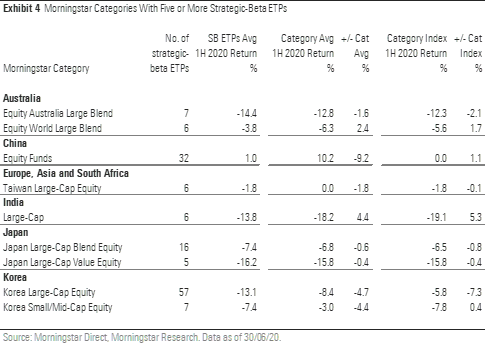
Exhibit 4 shows the Morningstar Categories in the Asia-Pacific Region for which there were more than five strategic-beta ETPs as of the end of June 2020. We compared these ETPs' average first-half 2020 performance with their respective categories and their category indexes. In five out of the nine categories, the average strategic-beta ETP underperformed both its average category peer and its category index. Randomly picking from these strategic-beta ETPs did not yield favorable results. The India large cap was a category where strategic-beta ETPs fared relatively well. This owes mainly to the skew in product availability in the local market. Of the six strategic-beta ETPs in the India large-cap category, three of them belong to the value strategic-beta group. In the first half of 2020, India bucked the global trend of underperformance among value stocks. The MSCI India Large Cap Value Index outperformed the MSCI India Large Cap Index and the MSCI India Large Cap Growth Index by 5.0% and 9.9%, respectively.

In part 2 of this article, we will explore the performances in more details.


